On another occasion I’ll share the main views on why shares, why long term, why buy and hold etc. I kind of feel everybody already knows it. In any case, If you want to hold shares for the long run you need a way to understand what’s the upside, downside and how the ride is going to feel if it goes wrong, as it sometimes happen. In other words:
- Returns
- Risk Adjusted Returns
- Downside and risk
- Trend
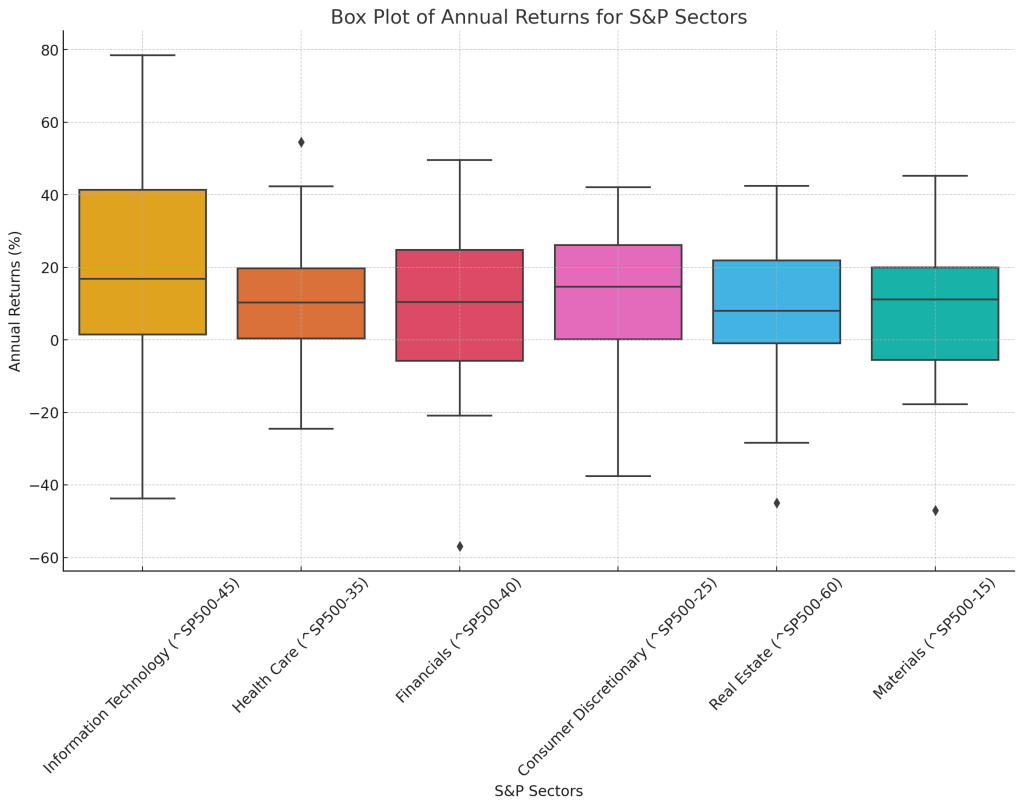
I have many interesting comparisons of different alternatives for the long run. Here is a sample comparison of several sectors.

And for the risk adjusted aspect (using a 2% annual risk free interest just for the sake of example):

Now this is of course not a recommendation for investing, you should really do your homework or discuss someone. It is however an interesting way to compare, and to kick off your analysis.
For the boxplot fans out there (is that a thing? i really like them), It tells the same story, easy to see the two on the left. Do note the outliers, the one on the financial sector is a big one. For the tech high of 1999 or financial high of 2007, it went down and took more than 10 years for each sector to recoup the loss, but that’s an edge case where you bought on the highest high. If you don’t try to time the market and don’t sell when it’s hard, you should do fine.
Disclaimer: The information provided in this blog is for educational and informational purposes only. It is not intended as investment advice or a recommendation to buy or sell any financial instruments. Please conduct your own research and consult with a financial advisor before making any investment decisions.
